← All case studies
Bravecto Quantum
·
iPad
·
2025
Bravecto Calculator
Designed iPad revenue calculator that reduced vet calculations from 5 minutes to 30 seconds—adopted by 200+ sales reps.
Revenue calculator — iPad

iPad
The 30-second version
0:30 read
Role
Lead UX/UI Designer
Team
B2B
Timeline
Ipad
Platform
iPad
Problem
To overcome this market resistance, our stakeholders—Mitch Fuqua, Nicole Moroney, and Rossana Gutierez—tasked our team with building a zero-to-one pricing calculator. The goal was to equip over 200 pharmaceutical sales representatives with a tool that could instantly demonstrate how switching to Bravecto Quantum would dramatically improve clinic compliance and overall revenue. The calculator needed to be deployed as an HTML application on the VERA iPad platform, tailored specifically for time-constrained clinic visits.
73%
Completion rate across 200+ sales reps
32 sec
Data entry time, reduced from 5 minutes
+30%
Clinic engagement rate
01 Context
Overview
The veterinary pharmaceutical market has long been conditioned to purchasing flea and tick preventatives in monthly (or 12-weekly) SKUs. When Bravecto Quantum was developed as a single-vial treatment capable of protecting a dog for a full year, it represented a massive leap in medical convenience. However, this innovation came with a significant B2B sales hurdle: a $915 default cost per vial. For veterinary clinics accustomed to lower upfront costs, the sticker shock was an immediate barrier to adoption.
The Solution
As the Lead UX/UI Designer, my vision was to transform the existing data models into a compelling, tablet-optimized revenue story. The tool couldn’t just be a functional calculator; it had to be a high-energy sales enablement asset.
By translating complex financial inputs into immediate, visual profit charts, we aimed to restore the sales representatives’ credibility and give them the confidence to pivot their pitches on the fly.
Before
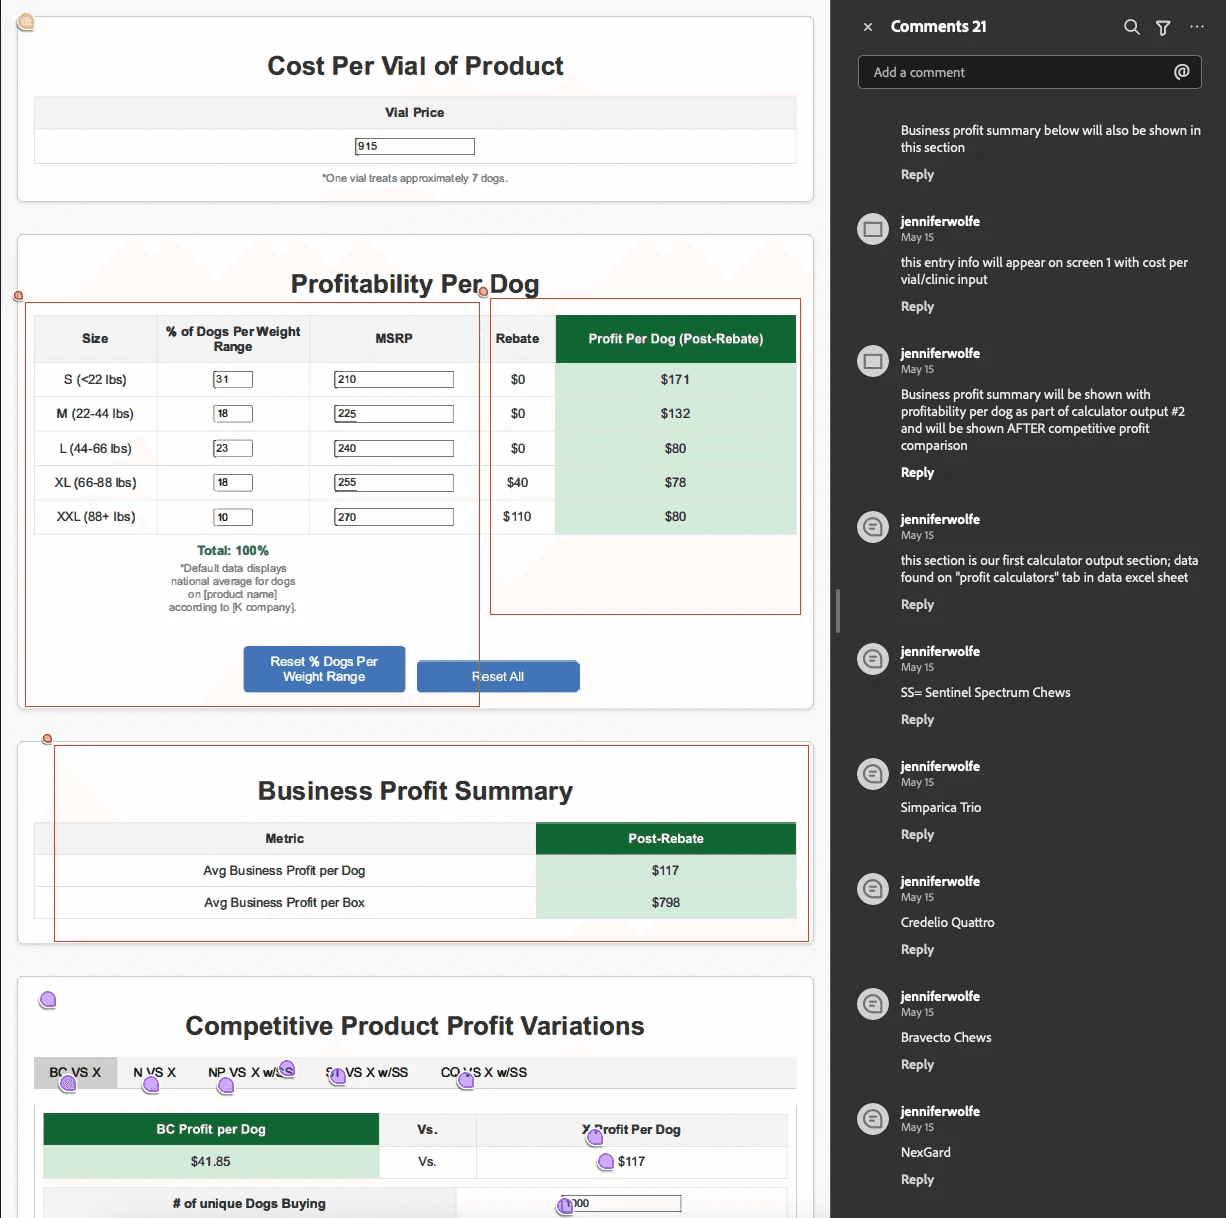
An Excel-like interface that wasn’t practical for tablets. Confusing navigation with no sense of progress. Wrong data displayed in unclear ways. Users couldn’t tell where they were in the process or understand the results.

After
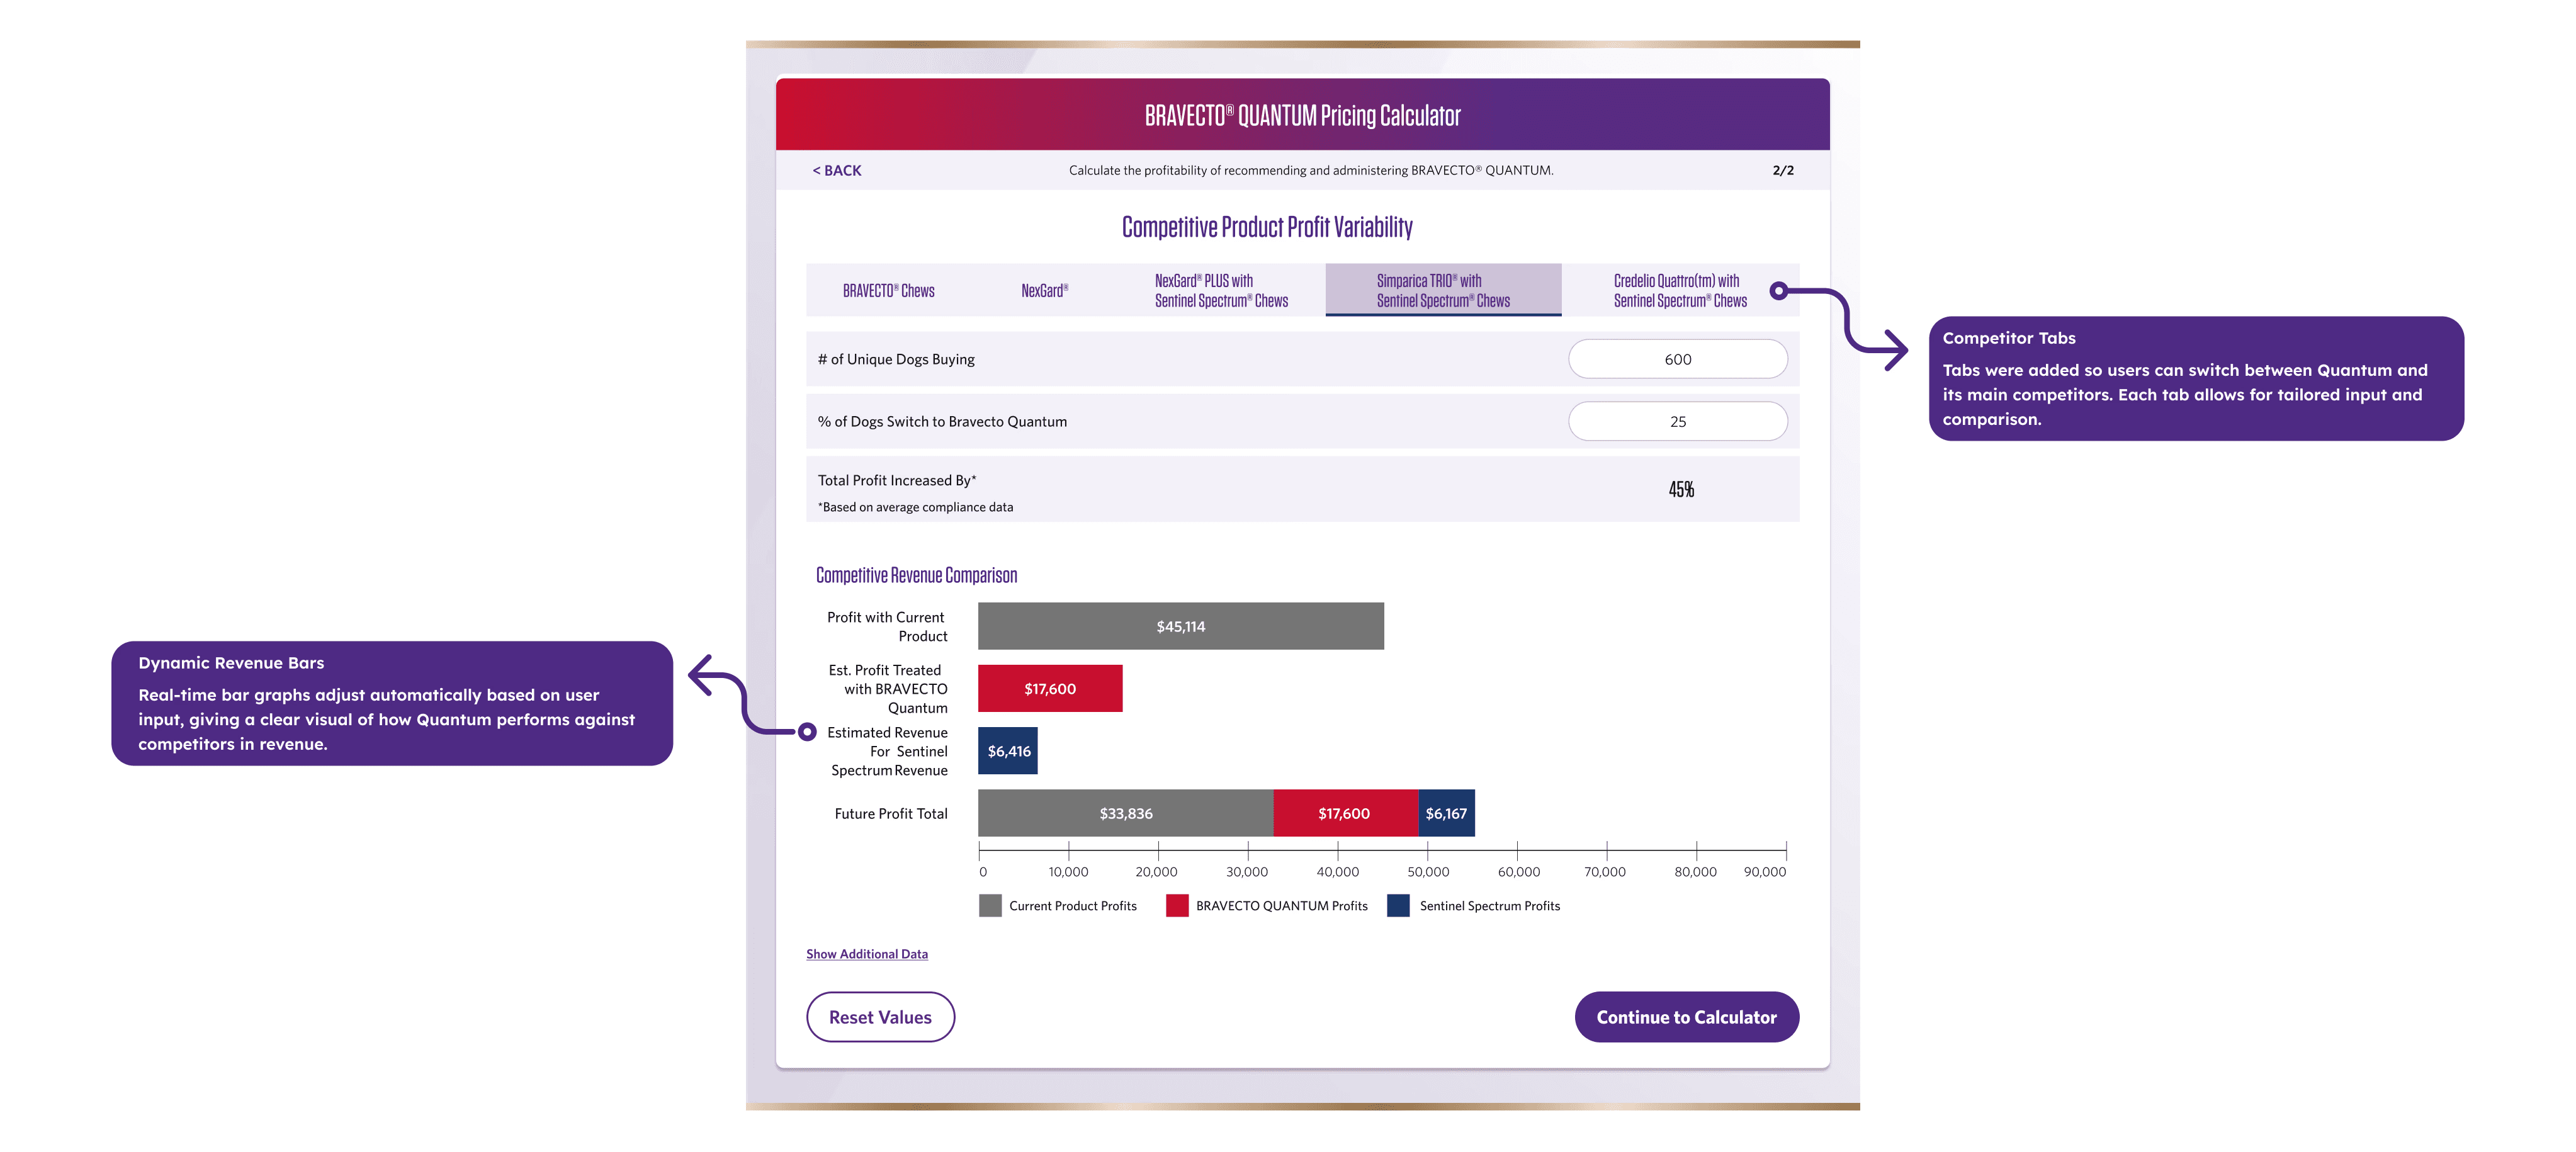
A clean, tablet-optimized interface with numbered steps showing progress. Clear tabs for competitor comparisons. Visual bar charts making profit differences immediately obvious. Focused inputs on each screen guiding users forward.

02 Research
Discovery & Navigating Ambiguity
At the project’s kickoff on May 13, I began by evaluating the legacy solution. The existing tool was essentially an Excel-like grid crammed onto a screen, featuring dense typography, confusing navigation, and no sense of progress. Users couldn’t tell where they were in the flow, and wrong data was frequently displayed in unclear ways. It was immediately apparent why reps were losing deals: the tool was actively sabotaging their 30-second elevator pitches.

To understand the real-world context, I conducted shadowing sessions during actual clinic visits. These sessions revealed that the problem wasn’t merely usability; it was the high-pressure environment of veterinary sales. Reps walked into clinics prepared, only to watch meetings unravel as they scrolled through dense grids and searched for buried data. The technical terminology further slowed down the veterinarians, causing the reps to lose the room and, crucially, their professional credibility.
Insights: Understanding the High-Pressure Environment
The ambiguity lay in balancing the need for comprehensive medical data with the absolute necessity for speed. We had to accommodate complex variables—like the percentage of dogs in specific weight bands, rebate payments for XL ($40) and XXL ($110) sizes, and comparisons against established competitors like Nexgard Plus and Simparica Trio—without overwhelming the user. Every second spent looking at the screen was a second not spent making eye contact with the clinic decision-maker.
03 Decisions
Strategy: Mapping the High-Velocity Flow
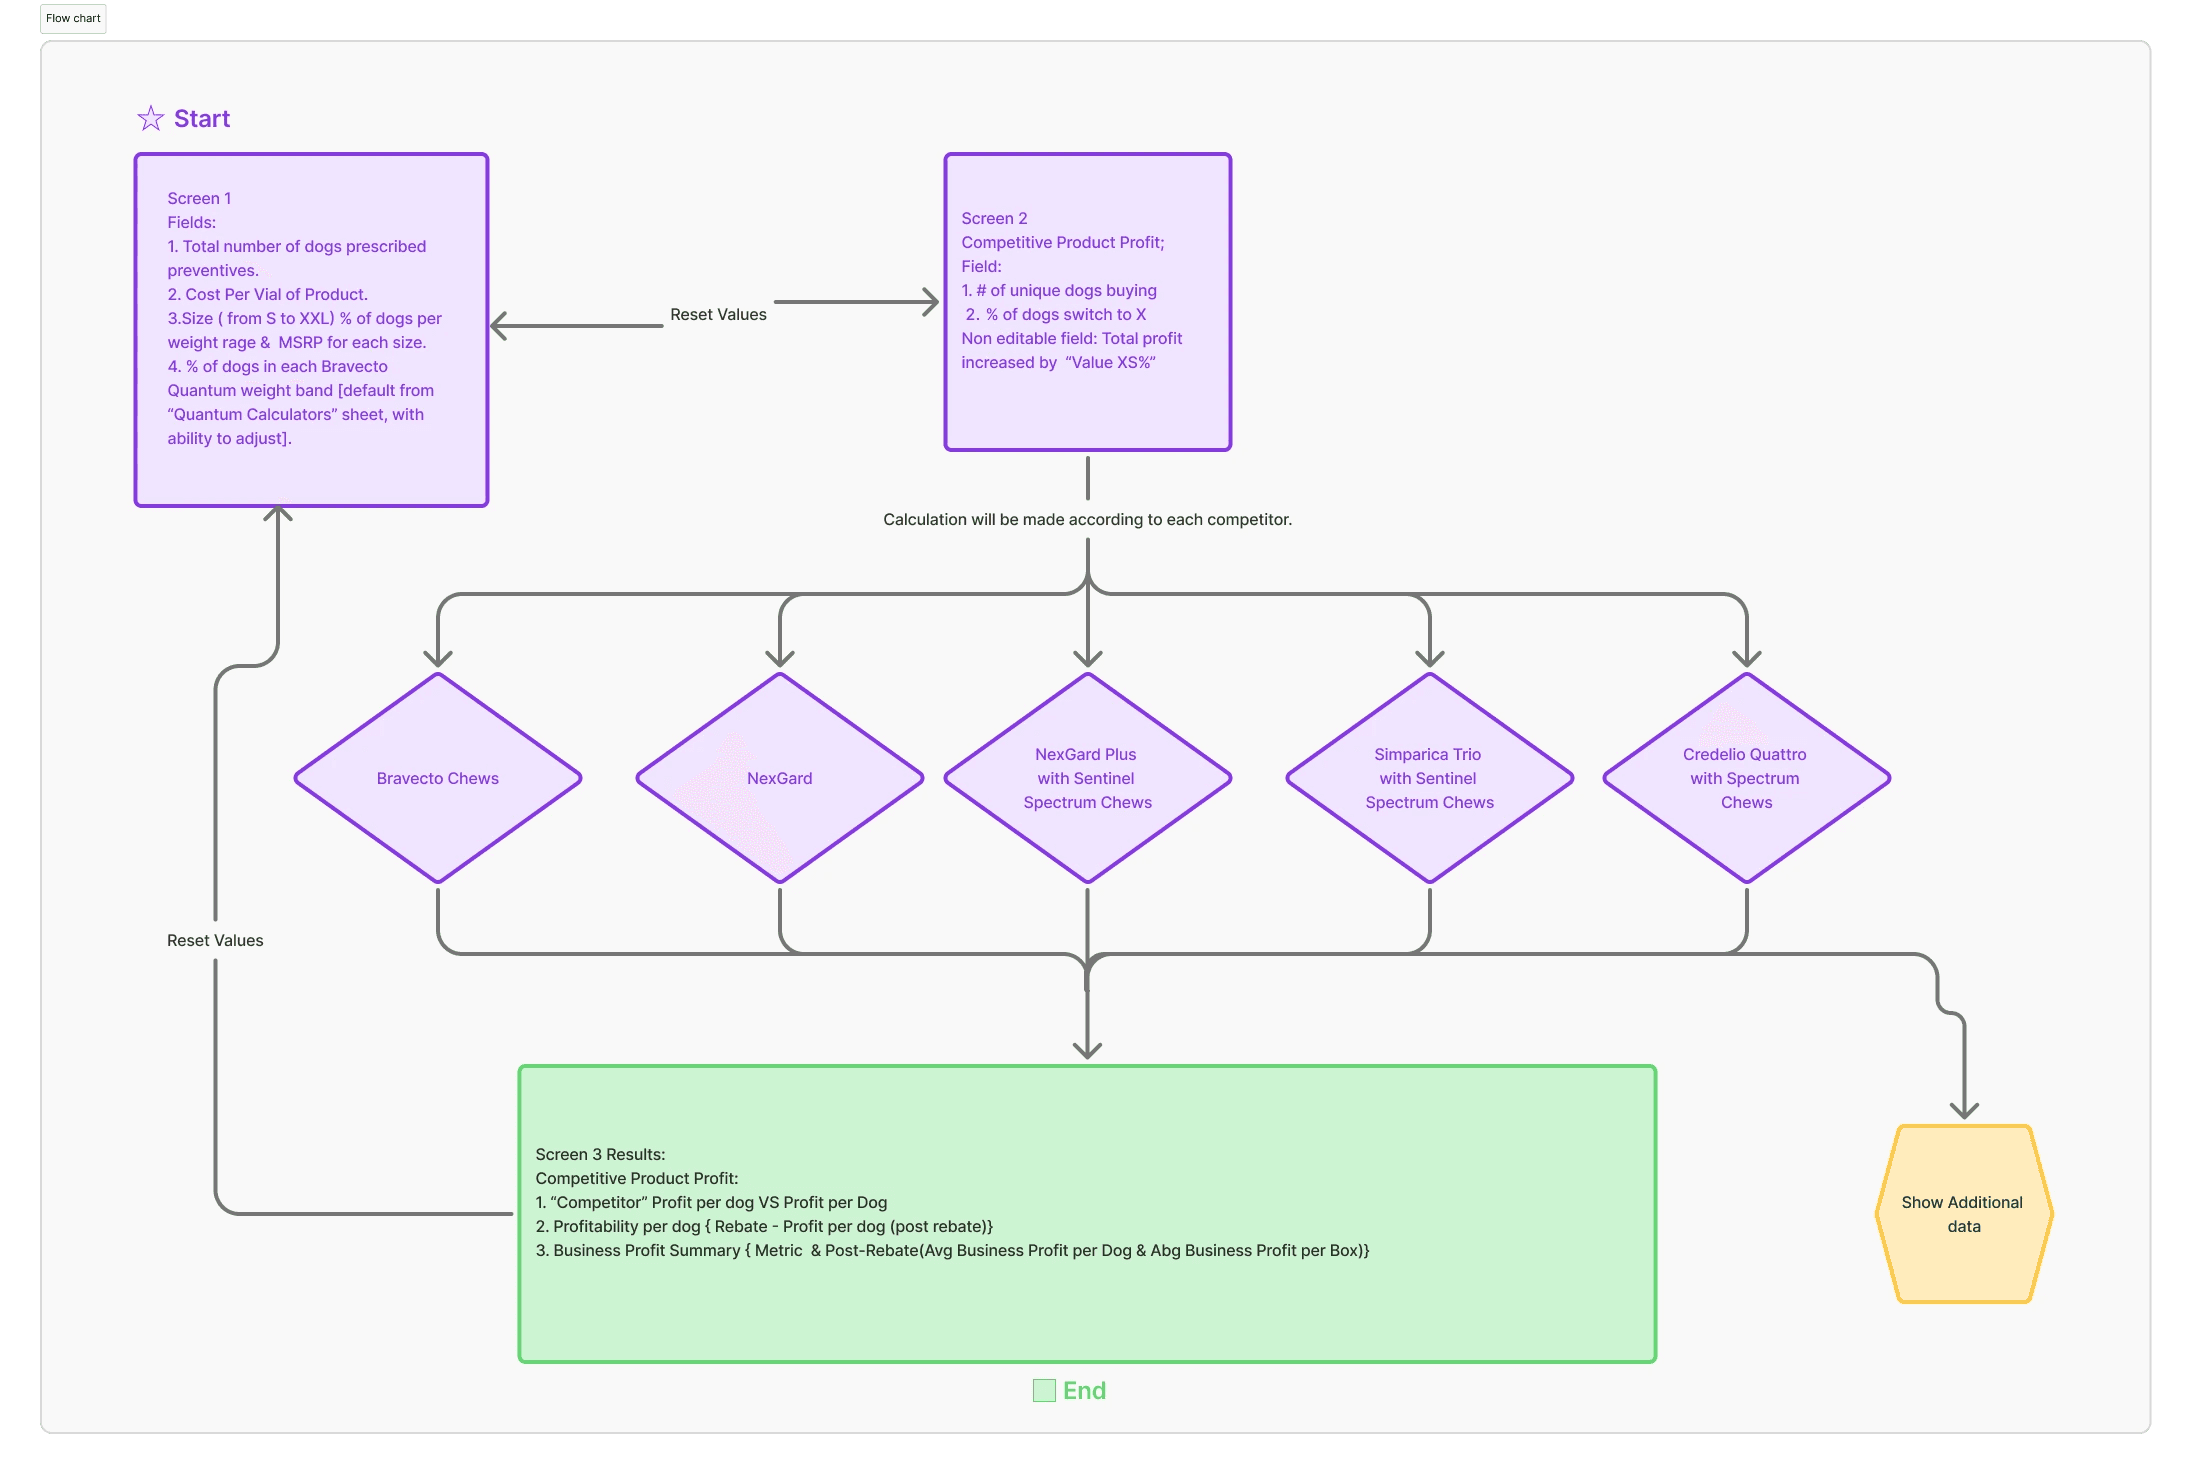
To respect the user’s high-pressure environment, I restructured the information architecture. The final structure evolved through three distinct approaches, each tested against the reality of a 30-second pitch.
Alternative 1: The Dashboard (rejected)
All data on one screen. Tested with 5 reps. Vets felt overwhelmed, couldn’t find revenue fast enough.
Alternative 2: The Linear Wizard (rejected)
Strict 5-step progression. Power users rejected it: “If I’ve used this 20 times, don’t make me click through everything.”
The Winner: Hybrid Flow (selected)
Three focused screens with strategic escape hatches:
Screen 1 (Input): Clinic enters their numbers, dog counts, pricing, weight distribution. Only what’s needed to start.
Screen 2 (Competitors): Rep selects which competitor to compare. Tabs remain sticky—always accessible, never buried.
Screen 3 (Results): Revenue revealed immediately. Two-tiered view: high-level profit summary first, deeper business metrics one tap away.
Why it won: During testing, one rep described it as “Training wheels I can kick off when I know the route.” Guided new users, gave veterans speed.

First Principles Design
With the Hybrid Flow validated, I began wireframing to validate the core visual hierarchy. Operating from first principles, the primary directive was speed. Before applying any brand skin, I introduced numbered progress steps at the top of the interface. This visual stepper reduced abandonment by showing users exactly where they were in the 30-second flow, ensuring they never felt lost in the data.
Guided Flexibility
Provide a clear, numbered path for new users, but include “escape hatches” like the Quick Profit Skip for power users.
Real-Time Responsiveness
Every input must instantly update the bottom-line visual charts to maintain conversational momentum.
Visual Proof
Move from “pricing hurdles” to “revenue opportunities” by making financial benefits scannable at a glance.
To address the need for seamless competitor comparisons, I designed a “sticky” comparison tab system. This ensured that critical data remained accessible and never buried, allowing reps to toggle between comparisons against Bravecto Chews, Nexgard, and Credelio Quattro without losing their place or reloading screens. This modular approach kept the cognitive load low while maintaining high data density.
Structure: Putting Ideas into Paper
Wireframing for Speed
The next challenge was translating dense numerical data—like the $117 average business profit per dog—into a scannable format. I moved away from static tables and designed customizable real-time tables where clinics could adjust weight ranges and MSRP on the fly. As values updated instantly, it maintained conversational momentum and proved the calculator’s responsiveness to the clinic’s unique data.

Design: Reskinning with Purpose
Translating Brand into UI
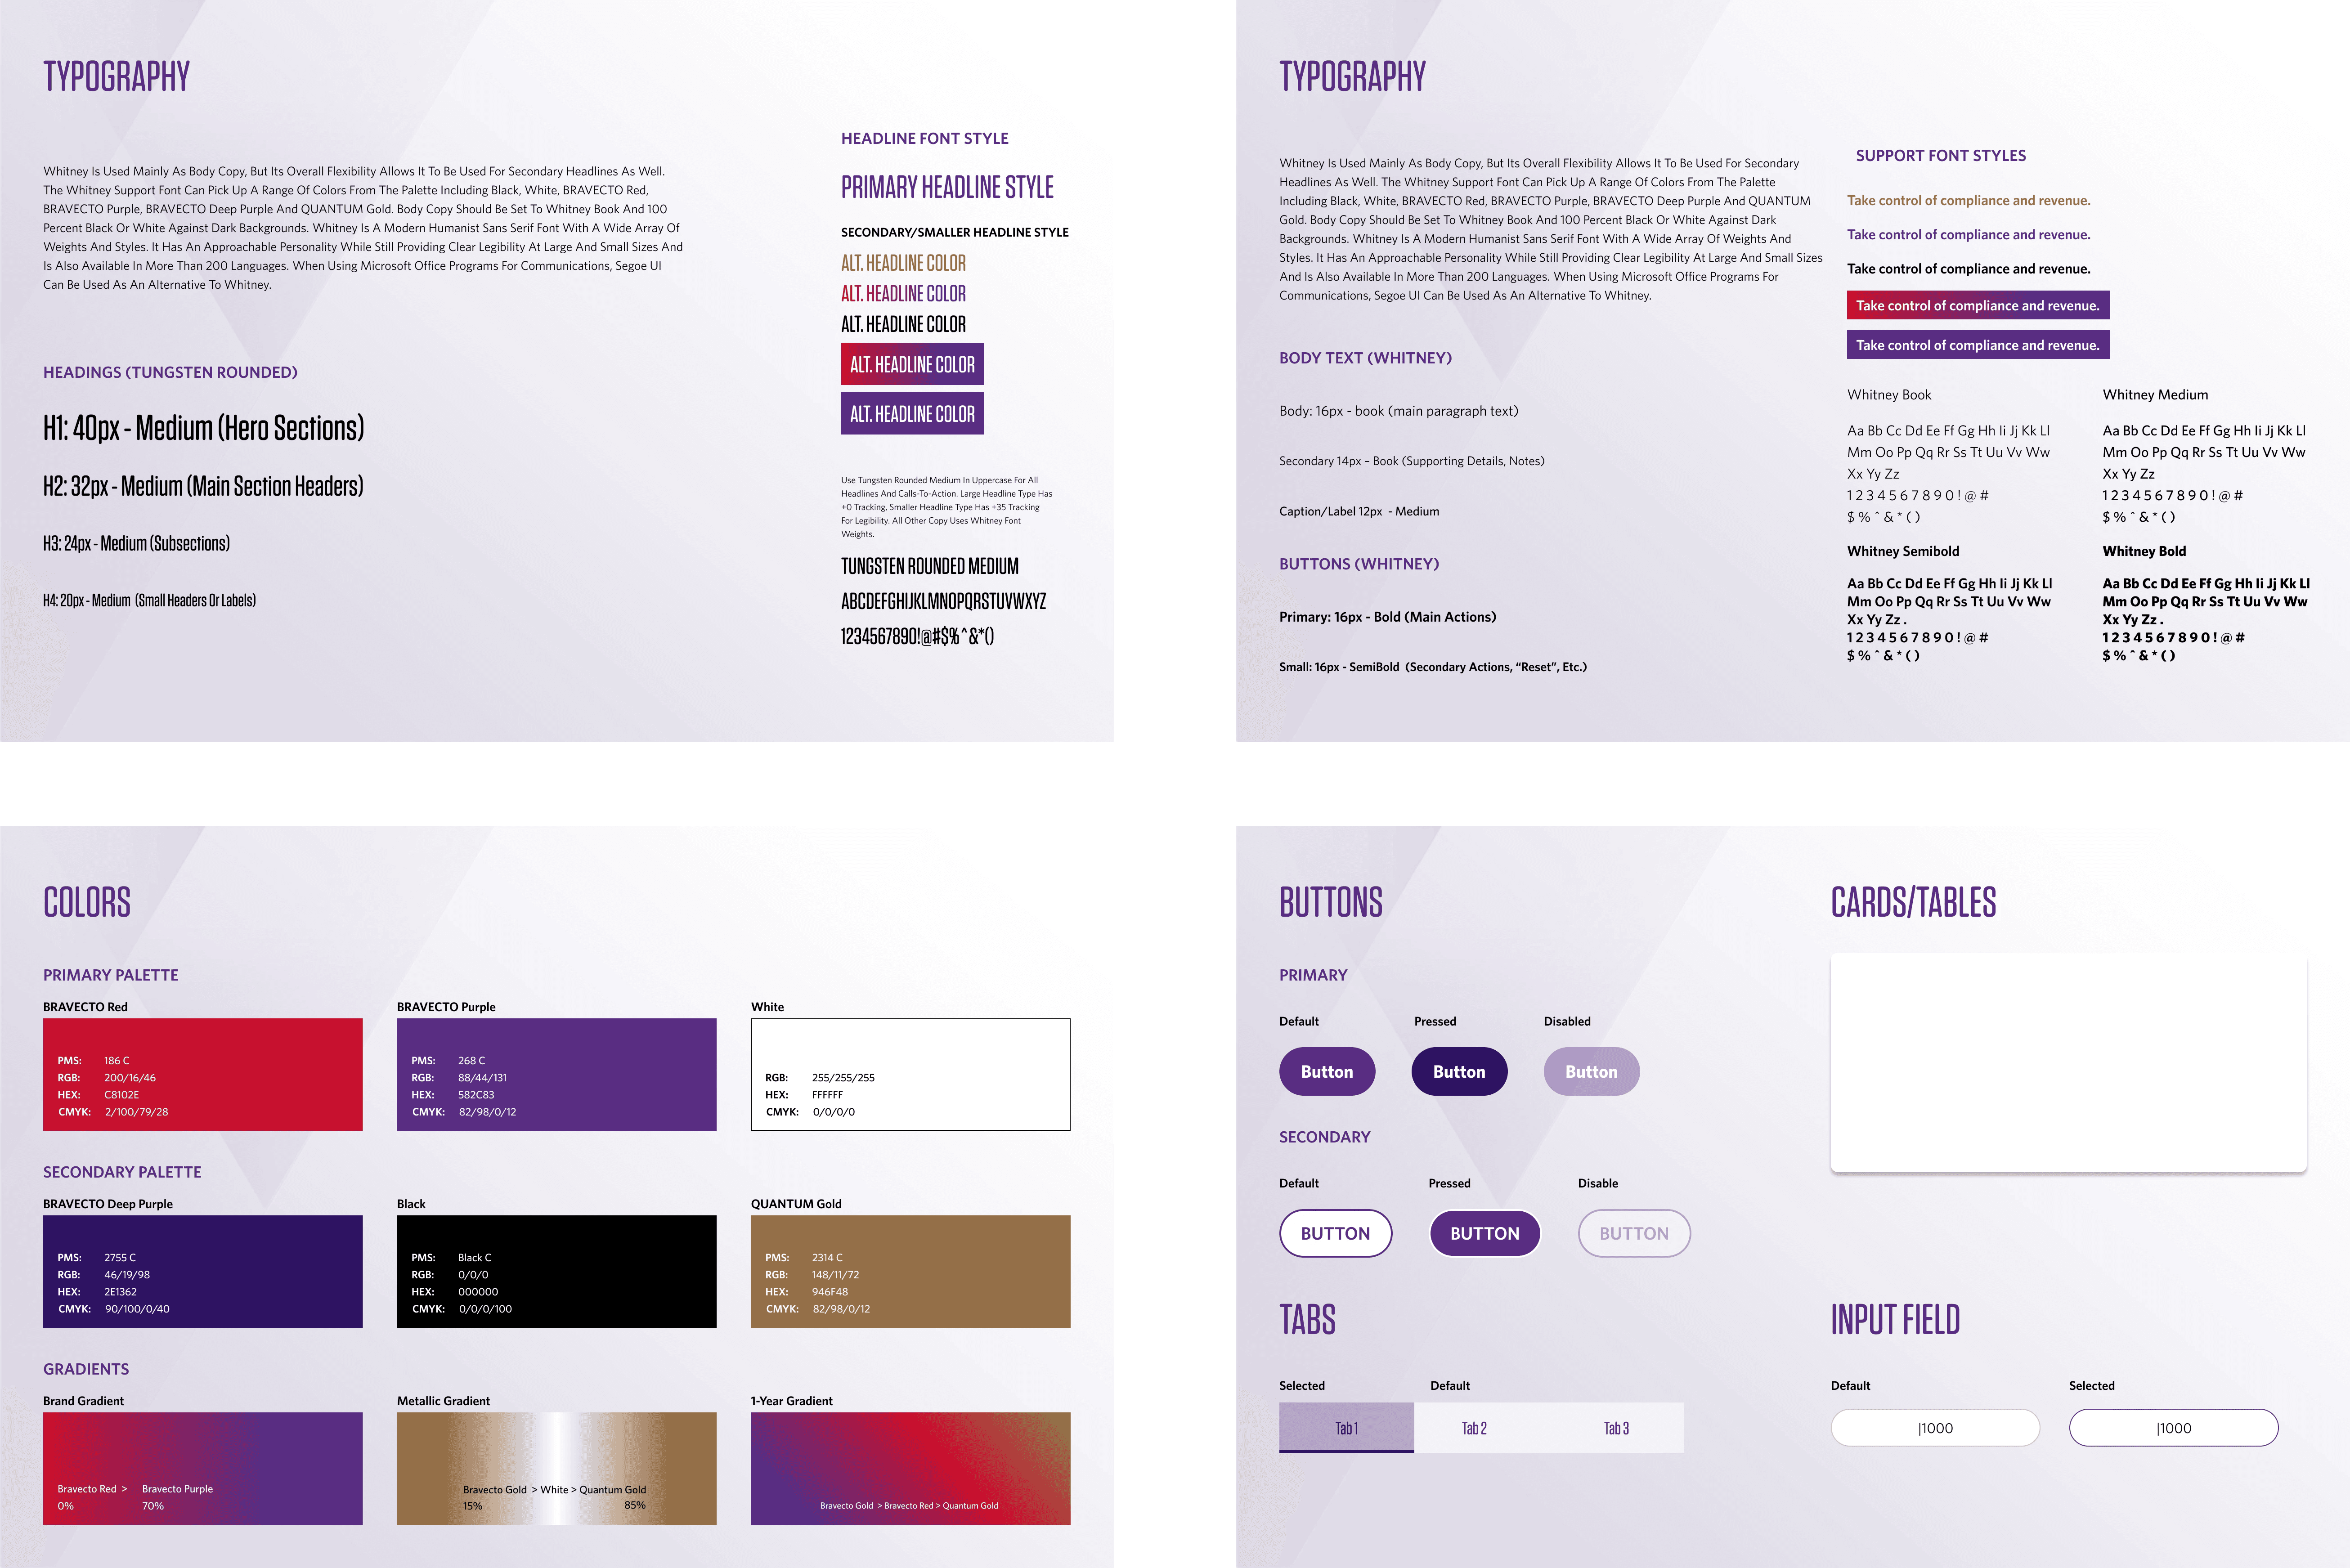
The final phase was transforming the existing Bravecto brand campaign into a functional Design System. I built a library of modular components that balanced medical credibility with high-energy sales aesthetics.

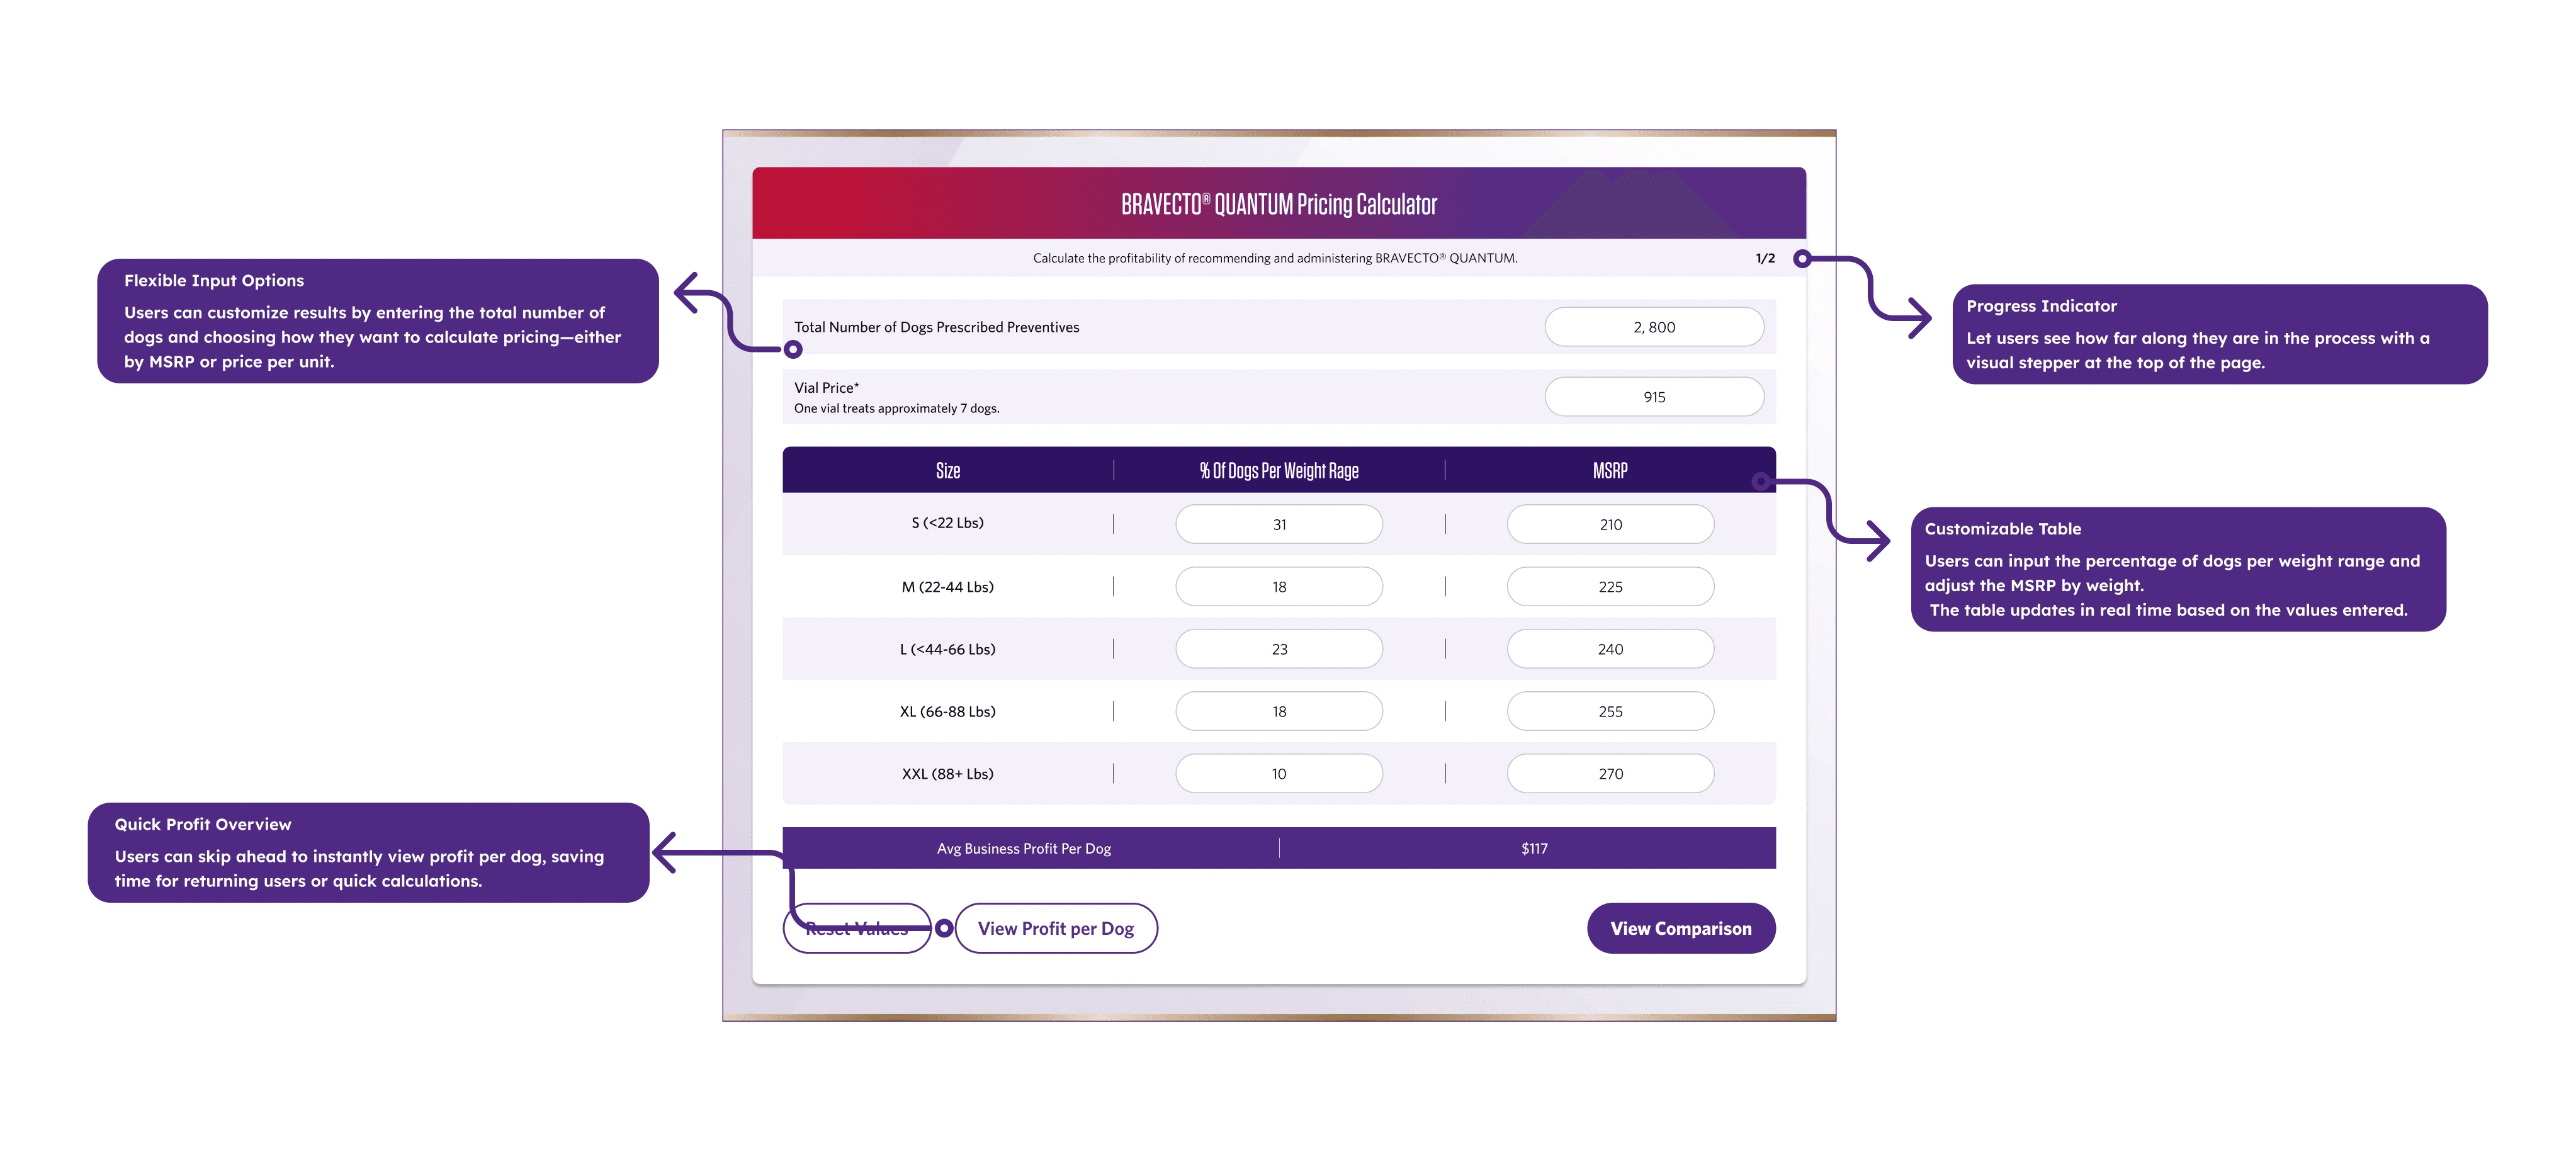
Guided Data Entry & Real-Time Feedback
I replaced the static spreadsheet with a flexible, interactive input system. This allowed sales reps to pivot their pitch instantly based on the clinic’s unique data.
Progress Indicators: A visual stepper at the top reduces abandonment by showing users exactly how far they are in the 30-second flow.
Customizable Real-Time Tables: Clinics can adjust weight ranges and MSRP on the fly, with values updating instantly to maintain the conversational momentum.
Quick Profit Skip: For returning users, a “skip ahead” feature provides instant profit-per-dog results, bypassing the full flow for high-speed interactions.
Flexible Pricing Logic: Reps can choose to calculate by MSRP or price-per-unit, catering to the specific financial language of each veterinarian.
Visualizing the Competitive Edge
To move the conversation from “pricing hurdles” to “revenue opportunities,” I designed a comparison system that makes the financial benefits of Bravecto scannable at a glance.
Competitor Comparison Tabs: Interactive tabs allow for tailored comparisons between Quantum and its main market rivals without leaving the screen.
Dynamic Revenue Bars: I transformed dense numerical data into real-time bar graphs that adjust automatically, making the profit gap visually undeniable.
Deep-Dive Financial Transparency
I created tiered data views to build trust with clinic decision-makers, providing both high-level summaries and deep-dive performance metrics.
Rebate & Post-Rebate Clarity (Tab 1): Directly addresses the clinic’s “pricing hurdle” by showing the immediate profit per dog after the rebate is applied.
Comprehensive Business View (Tab 2): Provides a deeper performance analysis, breaking down profit per dog, per vial, and average business totals for practice managers.

04 Result
Traction & Business Impact
The post-launch metrics confirmed that our focus on speed and visual storytelling paid off massively. Internal analytics revealed that the new calculator achieved a remarkable 73% completion rate across the sales force. Reps were no longer abandoning the tool mid-pitch; they were using it to drive the conversation to a successful close.
73% Completion Rate — Achieved across 200+ sales reps. 32 sec Data Entry Time — Reduced from 5 minutes. 30% Engagement Rate — Increase in post-pitch survey responses.
Most critically, screen recording analysis showed that the time spent on data entry plummeted from an agonizing 5 minutes down to just 32 seconds. This 10x improvement in efficiency meant reps could spend their 30-second elevator pitch actually pitching, rather than fighting a spreadsheet. The “Quick Profit Skip” feature proved to be one of the most utilized elements, perfectly catering to veteran reps.
The business impact extended beyond just usability. Post-pitch survey responses indicated a 30% increase in clinic engagement rates. Veterinarians and practice managers were leaning in to look at the iPad, interacting with the real-time data, and clearly understanding the compliance and revenue benefits. We also saw a 15% increase in total product orders within the first quarter post-launch, cementing the tool as a critical asset for the MAH team.

Reflections: 0→1 B2B Design
Prioritize Clarity over “Completeness”
The Pivot: I initially assumed veterinarians wanted to see every data point from the original Excel sheet. Shadowing revealed the opposite: they only wanted just enough data to make a quick decision.
UX Impacts Professional Credibility, Not Just Speed
The Pivot: I originally treated this as a pure efficiency play (reducing clicks). But watching a rep’s shoulders drop when a legacy tool froze mid-pitch showed me the real stakes: a slow tool makes the rep look unprepared in front of a client.
What I’d Do Differently
Prototype with Reps and Vets Together, Earlier
Testing with reps first missed the actual clinic power dynamics.
Joint sessions would have shown sooner that vets are actively looking for reasons to end pitch conversations—meaning reps need tools designed to earn them the next five minutes, not just complete a transaction.
Next
More case studies.

All case studies →